As far as I'm concerned, a speculator always needs to keep this question in mind...
We've detailed many times how natural-resource industries like oil, gold, copper, and iron ore are among the market's biggest "boom and bust" assets. Get into the booms early and avoid the busts, and you can make huge returns in natural resources. (Read our educational interview with master resource financier Rick Rule for more on this.)
Most S&A readers know how natural resources in general enjoyed a huge boom period from 2002 to 2008. The benchmark commodity index (the CRB) rallied 135% during this time... which helped many resource stocks climb 200%, 300%, even 500%.
Like most every asset, natural-resource stocks were killed in 2008... and then rallied into early 2011. Since then, however, it's been all downtrend in natural resources.
And today, I'm going to show you why I think it's still a good idea to mostly avoid this sector.
As you can see in the chart below, BHP reached $95 per share in early 2011. Since then, it's been locked in a giant downtrend that has taken shares to $65.
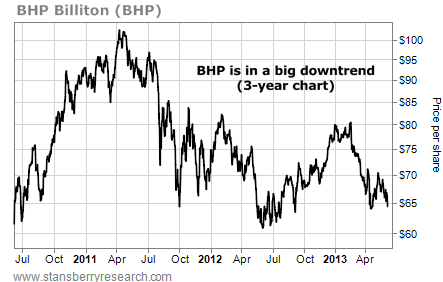
A downtrend like this can create bargains... But sentiment toward miners like BHP isn't "black death terrible." That means you're not getting this stock at a bargain price. I'll wait for a "wash out" before getting interested here.
As you can see, it's the same story as BHP. The trend continues downward...
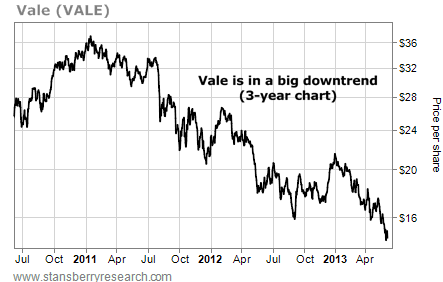
The Chinese economy isn't growing fast enough to absorb the world's iron-ore production... and prices are collapsing. But again, there's been no "wash out" selling climax in this stock.
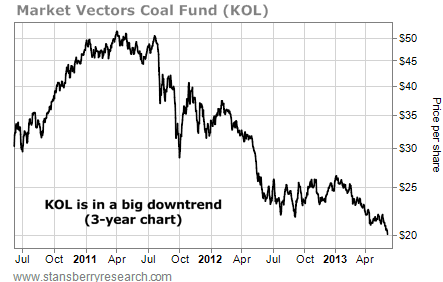
China is the world's largest consumer of coal. And just like iron ore, China isn't growing fast enough to consume global coal production.
The important Australian benchmark coal price index (Newcastle FOB) is trading near depressed 2009 levels. This has clobbered the Market Vectors Coal Fund (KOL), which holds large coal producers and related stocks. Shares struck a 52-week low this week.
While stocks like BHP, Vale, and KOL have declined since 2011, there's no panic selling going on here. At this point, it's just a gradual stair step decline that owes itself to the declining Chinese economy (with an "assist" from Europe's recession).
That's why it makes sense to avoid these sectors for now. They'll eventually reach screaming bargain prices. But they are not there right now.
Regards,
Brian Hunt
No comments:
Post a Comment